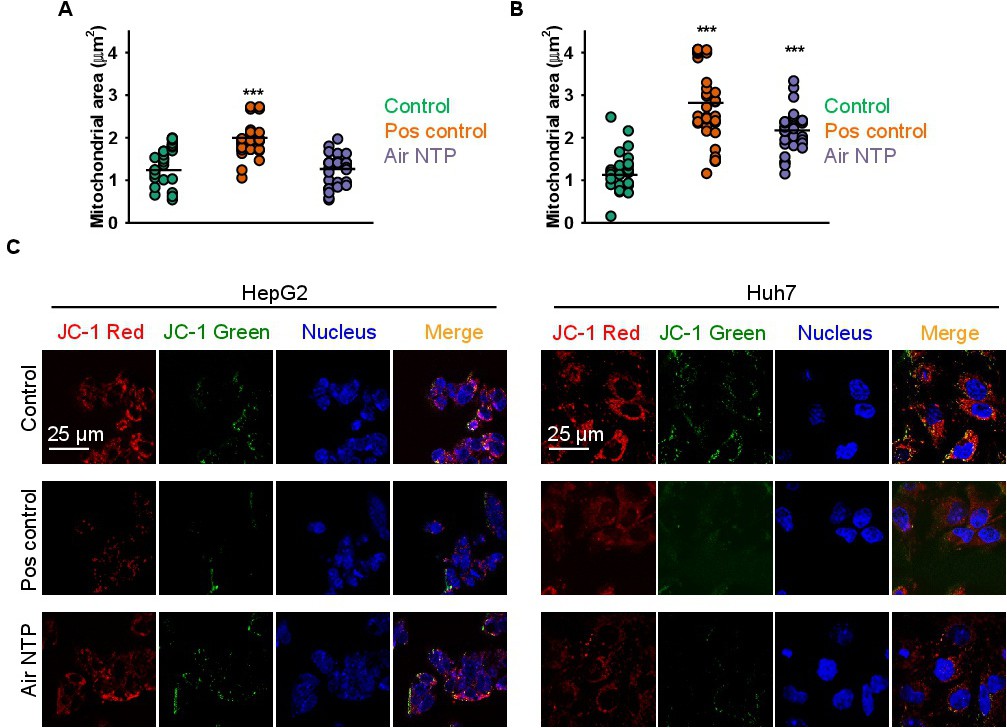
Fig. 5. Alteration of mitochondrial dynamics and induction of mitochondrial membrane depolarization by NTP treatment. HepG2 (A) and Huh7 (B) cells were treated with NTP for 60 s and stained with JC-1 (1 µM) 5 h post plasma treatment. Positive control - 20 % ethanol for 20 min. Pre-processed images of mitochondria stained with JC-1 as described in (Fig. 2A) were subjected to morphometric analysis for mitochondrial area. Morphometric analysis was performed using ImageJ (NIH). The data expressed as "Mean mitochondrial area (µm2)", n = 30-50 cells; ***P< 0.001. (C) Analysis of mitochondrial membrane potential in NTP-treated HepG2 and Huh7 cells. Cells were stained with 1 µM JC-1 probe 5 h post plasma treatment, the JC-1 fluorescence was measured using confocal microscopy. Representative images out of four independent experiments are shown. Positive control - 20 % ethanol for 20 min. Nuclei were labelled with NucRed(r) Live nuclear stain (blue).